
A few weeks ago, I was having a discussion about the possibility of detecting the colour of user uploaded images. The idea was that if a dominant colour was known, it could be used to create matching titles. I decided to give it a go using Python and Pillow.
Average Colour
Naively I tried averaging all the colours. This didn’t work so well.
def average_colour(image):
colour_tuple = [None, None, None]
for channel in range(3):
# Get data for one channel at a time
pixels = image.getdata(band=channel)
values = []
for pixel in pixels:
values.append(pixel)
colour_tuple[channel] = sum(values) / len(values)
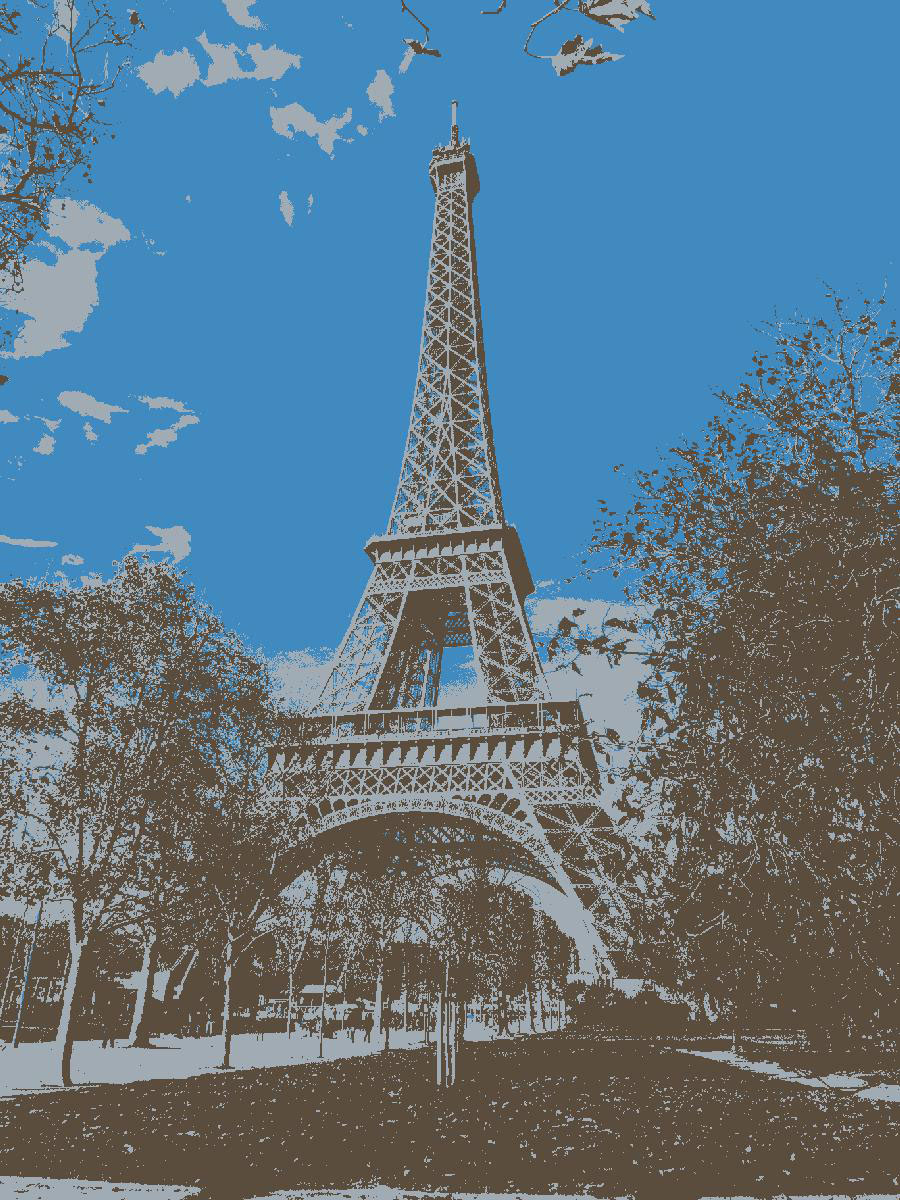
return tuple(colour_tuple)Here is the result on one of my photos from Paris.
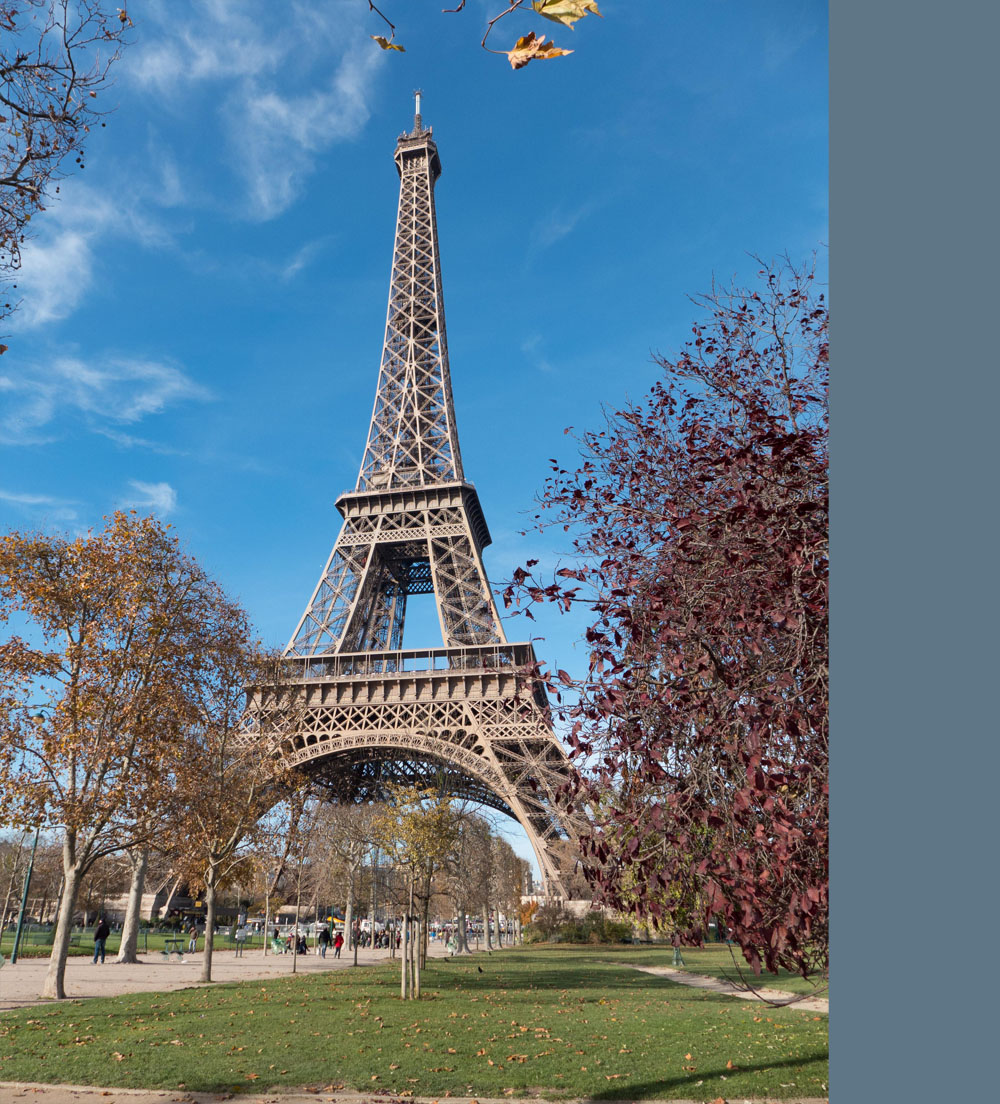
The green/blue/grey colour is the average of all the pixels. While I can see how this colour is the average (green and blue with bits of grey), it doesn’t represent a dominant colour of the image.
Colour Frequency
I thought a better approach could be to determine the most commonly occurring colour.
def most_frequent_colour(image):

    w, h = image.size
    pixels = image.getcolors(w * h)

    most_frequent_pixel = pixels[0]

    for count, colour in pixels:
        if count > most_frequent_pixel[0]:
            most_frequent_pixel = (count, colour)

    compare("Most Common", image, most_frequent_pixel[1])

    return most_frequent_pixel
This worked surprisingly well. The Pillow image.getColors() method conveniently returns a tuple containing all the colours in the image and the number of times the colour occurred.
This is the result on the same image.
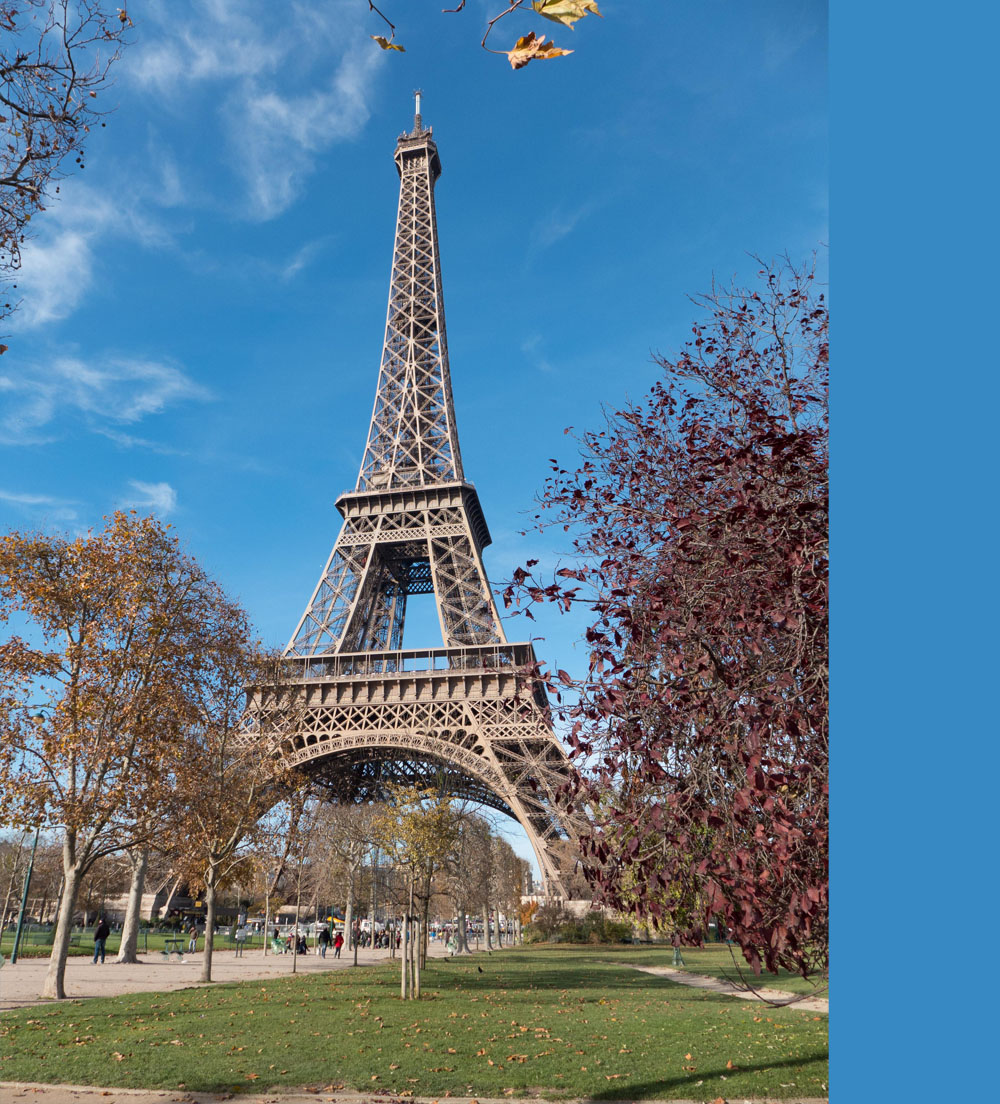
The selected colour nicely matches the image.
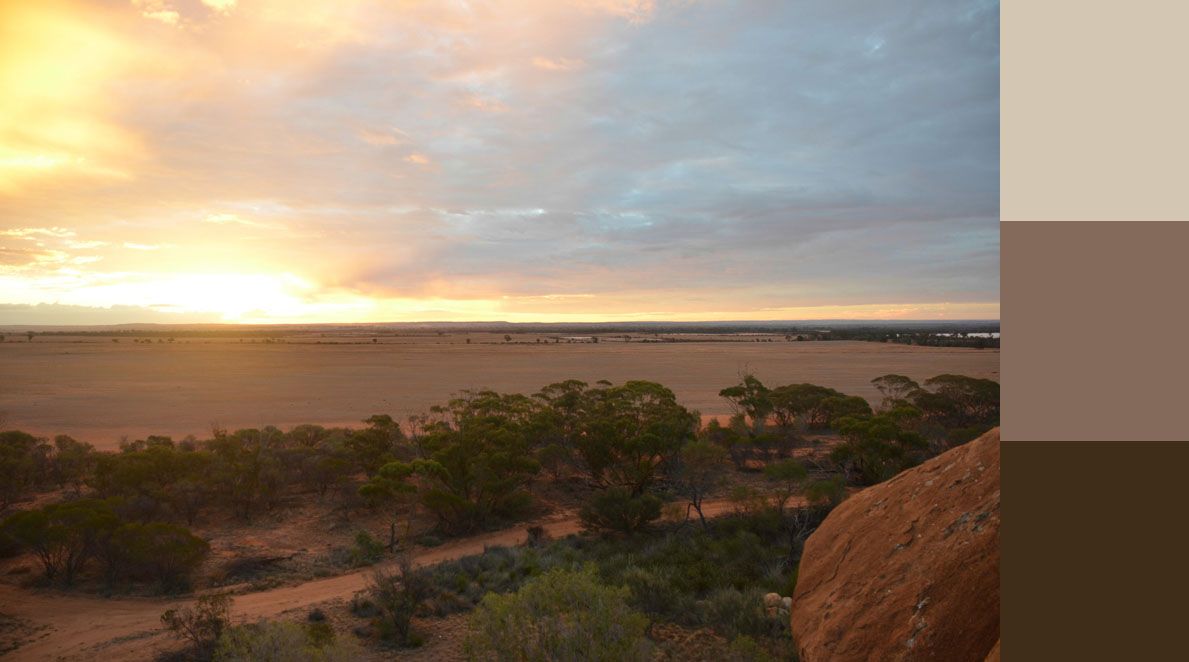
The most frequent colour method starts to run into problems when its run against photos which are over or under exposed.
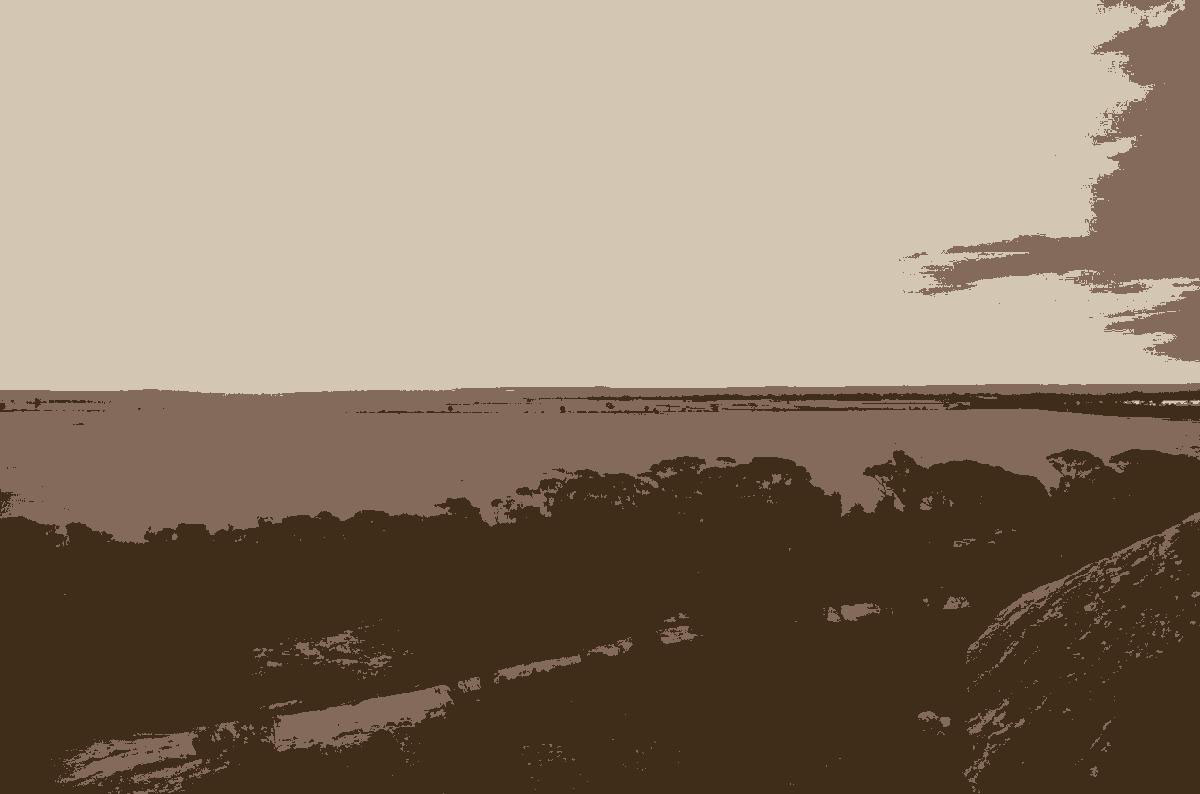
This is photo I took in the West Australian Wheat Belt while I was on a climbing trip. Although its not too bad, the distant sun has caused a small area to be overexposed.
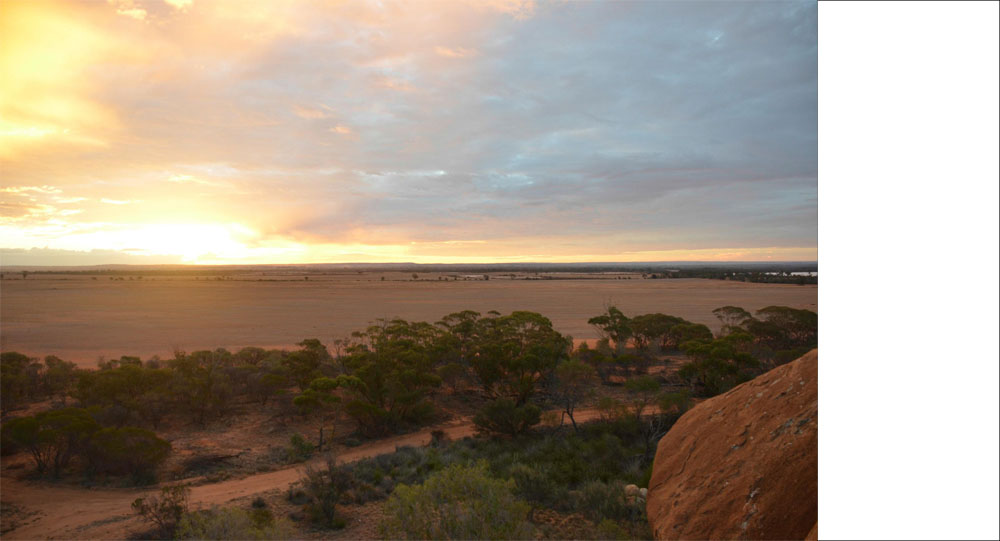
Yep, white is the most common colour in this image. The overexposed sun caused a small area to be clipped. This small patch of white is enough to be the most common colour in the image.
K-Means Clustering
The K-Means algorithm works by separating the pixels into K groups (clusters) of similarly coloured pixels.
This post by Charles Leifer explains the process well.
The Process
To understand this implementation of the algorithm, you need to grasp that a RGB colour value is really just a point in 3D space. Once you understand how this relates to a clustering algorithm, the rest is fairly simple.
First, pick K random pixels from your data set. Use these as the initial centroids for each cluster. You then repeat the following steps until an exit condition is satisfied.
- Assign the pixels to the closest cluster.
- Calculate a new centroid for each cluster by averaging all the pixels.
- Repeat from 1, start reassigning pixels based on the new centroid.
After a number of iterations, the centroids will begin to stabilise, this is a good way to determine the exit condition. In my experience this can often happen within only a few iterations.
Code
import Image
import random
import numpy


class Cluster(object):

    def __init__(self):
        self.pixels = []
        self.centroid = None

    def addPoint(self, pixel):
        self.pixels.append(pixel)

    def setNewCentroid(self):

        R = [colour[0] for colour in self.pixels]
        G = [colour[1] for colour in self.pixels]
        B = [colour[2] for colour in self.pixels]

        R = sum(R) / len(R)
        G = sum(G) / len(G)
        B = sum(B) / len(B)

        self.centroid = (R, G, B)
        self.pixels = []

        return self.centroid


class Kmeans(object):

    def __init__(self, k=3, max_iterations=5, min_distance=5.0, size=200):
        self.k = k
        self.max_iterations = max_iterations
        self.min_distance = min_distance
        self.size = (size, size)

    def run(self, image):
        self.image = image
        self.image.thumbnail(self.size)
        self.pixels = numpy.array(image.getdata(), dtype=numpy.uint8)

        self.clusters = [None for i in range(self.k)]
        self.oldClusters = None

        randomPixels = random.sample(self.pixels, self.k)

        for idx in range(self.k):
            self.clusters[idx] = Cluster()
            self.clusters[idx].centroid = randomPixels[idx]

        iterations = 0

        while self.shouldExit(iterations) is False:

            self.oldClusters = [cluster.centroid for cluster in self.clusters]

            print iterations

            for pixel in self.pixels:
                self.assignClusters(pixel)

            for cluster in self.clusters:
                cluster.setNewCentroid()

            iterations += 1

        return [cluster.centroid for cluster in self.clusters]

    def assignClusters(self, pixel):
        shortest = float('Inf')
        for cluster in self.clusters:
            distance = self.calcDistance(cluster.centroid, pixel)
            if distance < shortest:
                shortest = distance
                nearest = cluster

        nearest.addPoint(pixel)

    def calcDistance(self, a, b):

        result = numpy.sqrt(sum((a - b) ** 2))
        return result

    def shouldExit(self, iterations):

        if self.oldClusters is None:
            return False

        for idx in range(self.k):
            dist = self.calcDistance(
                numpy.array(self.clusters[idx].centroid),
                numpy.array(self.oldClusters[idx])
            )
            if dist < self.min_distance:
                return True

        if iterations <= self.max_iterations:
            return False

        return True

    # ############################################
    # The remaining methods are used for debugging
    def showImage(self):
        self.image.show()

    def showCentroidColours(self):

        for cluster in self.clusters:
            image = Image.new("RGB", (200, 200), cluster.centroid)
            image.show()

    def showClustering(self):

        localPixels = [None] * len(self.image.getdata())

        for idx, pixel in enumerate(self.pixels):
                shortest = float('Inf')
                for cluster in self.clusters:
                    distance = self.calcDistance(
                        cluster.centroid,
                        pixel
                    )
                    if distance < shortest:
                        shortest = distance
                        nearest = cluster

                localPixels[idx] = nearest.centroid

        w, h = self.image.size
        localPixels = numpy.asarray(localPixels)\
            .astype('uint8')\
            .reshape((h, w, 3))

        colourMap = Image.fromarray(localPixels)
        colourMap.show()
The algorithm can be pretty slow. I have used numpy arrays where possible, although I’m sure further optimisations are possible. A quick profile shows that most time is spent in the calcDistance() method. Look into KD-Trees or the Scipy Kmeans function if you really want to speed things up.
Results
These samples were run with k=3, and the min_distance=2.0
The results are usually quite good. Although because the starting centroids are chosen randomly, the algorithm can return slightly different results each time.
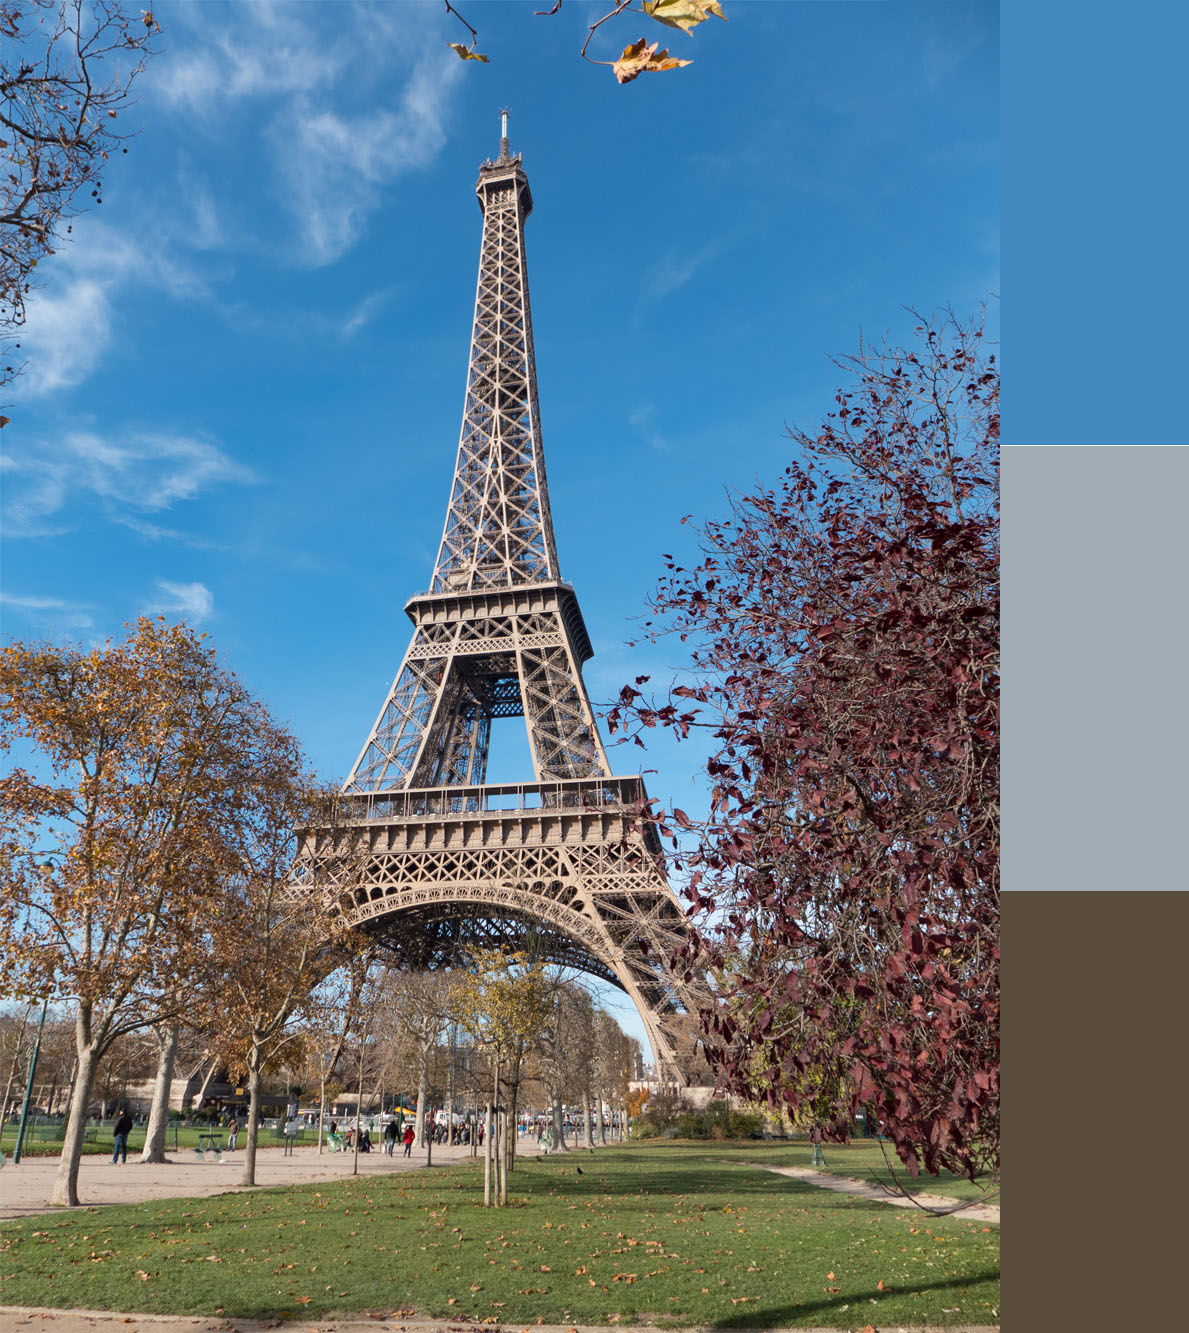
The Eiffel Tower test image.
Kmeans cluster map
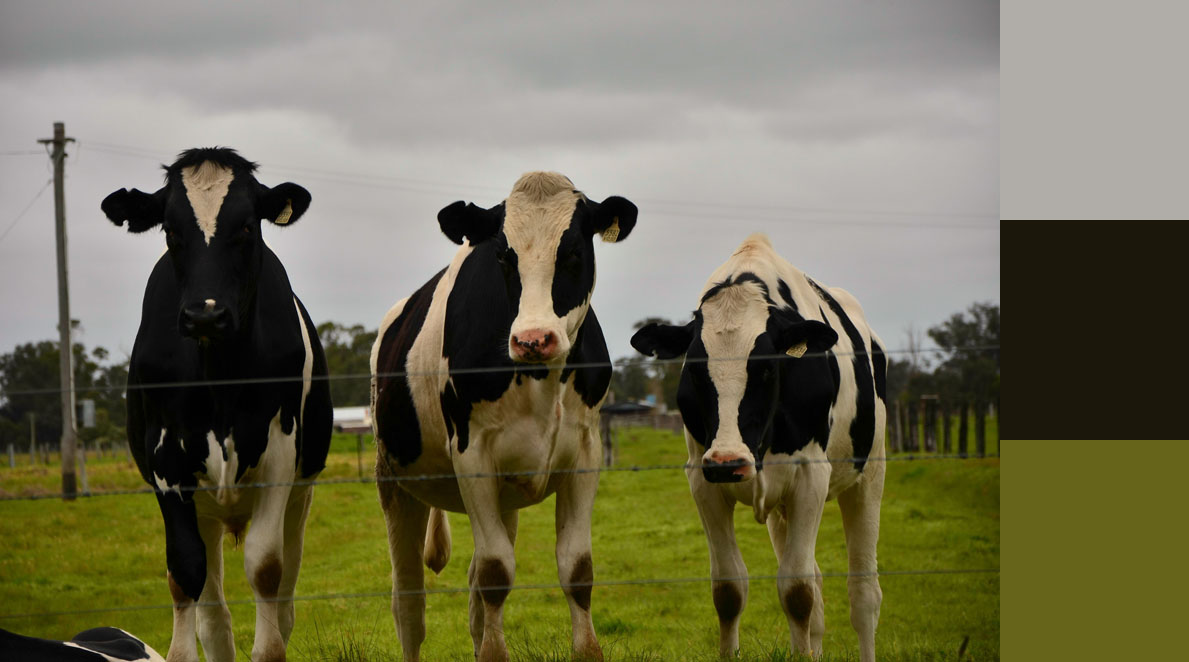
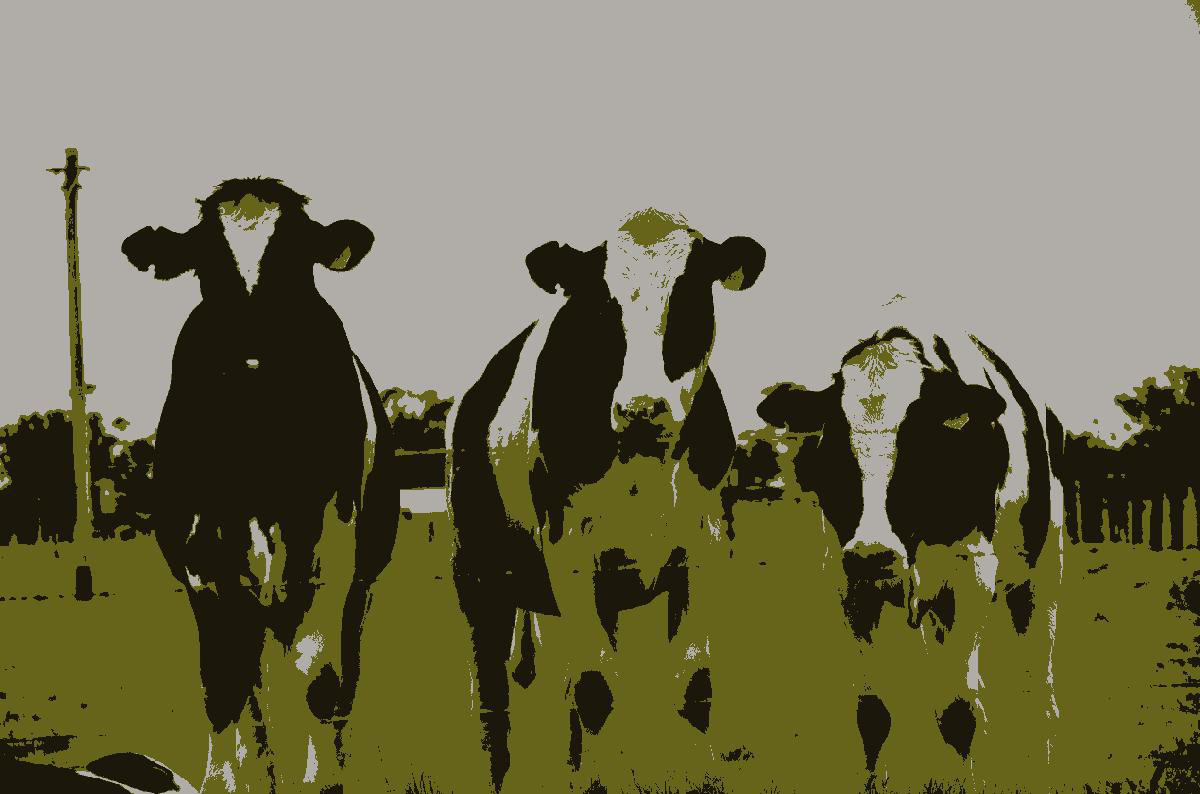
Some cows I found found near Bunbury.
The test overexposed image
The results from Kmeans seem to be pretty good. Some photos you will need to tweak K a bit to get the right number of clusters.
If you want to take this further, there are algorithms which can determine the ideal number of clusters to use. It’s also likely that better results can be achieved using a different colour space, like HSV or lab.
This project is also on GitHub: https://github.com/ZeevG/python-dominant-image-colour